Metrics and operational awareness at Voxer

Note: written in August 2012 during my summer at Voxer. sky has been released
as zag!
Please read the article on Voxer's no single point of failure architecture, as it explains how process rings work, and how Voxer's load balancing works.

What are the salient implementation features of our metrics solution?
Client side (on your app servers, which emit data)
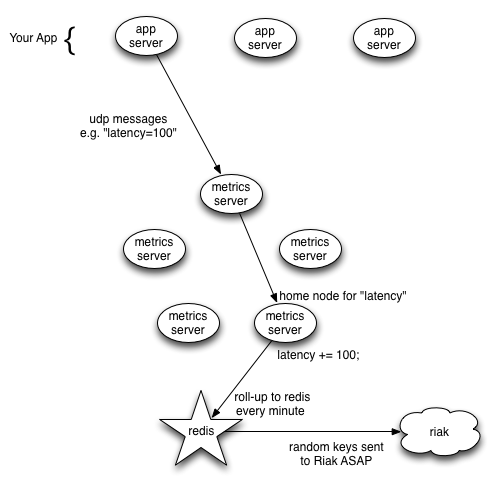
- metrics are coalesced into 1440 byte udp packets to optimize network efficiency
- handy node.js bindings which allow you simply call
sky.counter("http_status|200")whenever a certain call suceeds or fails - keys emitted with the form
http_status|200are rolled together with keys of the formhttp_status|404, giving you both information on, say, 404s, 200 OKs, AND the high-level view of how many http requests you are doing per minute.
Server side (on the skyservers which aggregate metrics data)
- skyservers form a ring, and clients load balance themselves so as not to overwhelm a single server
- intra-ring skyserver communication is also coalesced for efficiency.
- load balancing allows you to add more skyservers as the number of your appservers grows
- every minute, skyservers talk to a single redis server to roll-up their data
- the redis intermediary in front of riak allows for accurate counters,
because redis performs atomic
INCRoperations
Persisting data
- a rollup process continuously pulls keys out of redis and puts the latest time period of data into redis, simultaneously performing 5-minute rollups of the 1 minute data, if applicable.
- riak as our persistence medium allows us to keep historical data forever, as we can increase the size of our riak cluster by adding a machine.
Viewing metrics and adding new ones
- the redis server keeps a list of keys that have recently been emitted, and exposes this list to our graphing UI, meaning that to begin recording a new metric, you need not do any configuration, simply start recording it on your app servers. The Sky UI will simply pick it up and start showing it to you.
- the Sky UI will also hit redis for the latest minute's data, giving you real-time access to what is going on right now in your infrastructure.
Why didn't we just use etsy's statsd and whisper and carbon?
Etsy wrote a library called statsd, which works with whisper (the backend) to record metrics data. There are a couple reasons we chose not to use these technologies.
- rings of servers recieving metrics is the only way we can handle the volume of data being recorded by our app servers
- UDP as the transport mechanism allows our metrics servers to stay up, even if our app servers send too many events.
- riak allows us to store historical data forever (just add another machine)
- we think our graphing UI is pretty snazzy, especially since it has heat maps
If you'd like to read about Zag, our awesome graphing UI, please check out this article.
Thanks for reading!
David Trejo
@ddtrejo & DTrejo on github
